By Holly Kramer | Design Application Specialist
June 26, 2018
IA ANALYTICS PROVIDES NEW INSIGHTS INTO PROJECT DESIGN.
Over two years ago, IA began an initiative focused on the in-depth potential of data in workplace design to deliver new insights and enhance the design process.
This focus was the inspiration for IA Analytics, a group of data driven tools and services geared towards improving the connection between stakeholders—from clients to project teams—and their projects. Tying it all together is IA’s ability to tell a meaningful story with data delivered by Power BI generated interactive reports and dashboards (fig.1). The following is a quick summary of the current IA Analytics systems and their benefits for stakeholders.

Figure 1
IA Insight is our bespoke Utilization Study system, consisting of three modules: Create—a web-based app for project initiation; Survey—an iOS based app for our work onsite (Fig. 2); and Analyze—an automated yet customizable way to take back-end data and create interactive dashboards that best tell a story with the data (Fig 3). IA Insight opens the door for IA strategists and designers to better convey to our clients how space is actually being used and how to best plan for the future.

Figure 2

Figure 3
Design Data Mining
IA uses Revit firm-wide to design and document projects. When you break it down, Revit is basically a database with 3D architectural modeling overlaid. Through our project process, a significant amount of data is housed in our Revit models. The ability to extract the data from Revit and turn it into usable information is critical, if we want to realize a better understanding of what the design data is telling us (Fig. 4). Usable space data allows us to undertake new initiatives; the first two on our agenda are IA Benchmark and Project Karma.

Figure 4
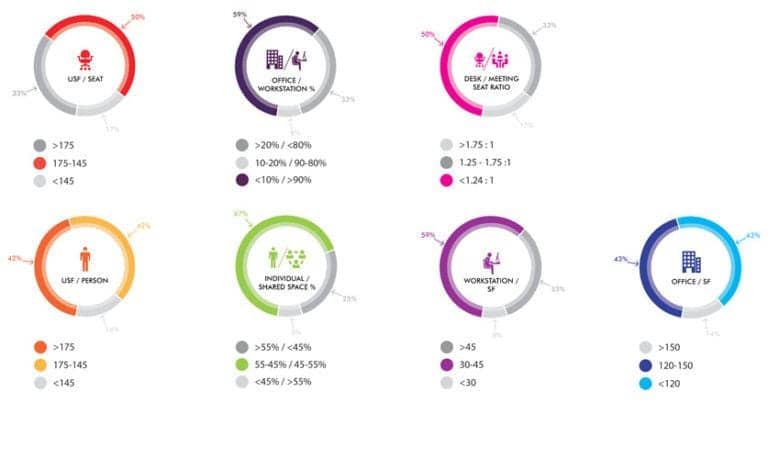
This initiative was inspired by requests from our clients and partners for benchmarking data to better understand and compare their real estate requirements. In response, our Workplace Strategy group developed a system based in Excel. But now we have replaced the Excel methodology with information about space taken directly from the Revit model—things like size, function, and headcount information. The data is supplemented with higher-level project information using our custom app. Then, with Power BI the desired metrics (Fig. 5) are delivered to make analysis more accessible. Anyone from project managers to client service representatives can view relevant data on projects, clients, and market sectors.
Project Karma
Project Karma centers on quality control and the assurance of IA Revit models, which are the basis of our deliverables from plans to the use of virtual reality. For every project in every office we promote the concept of building a virtual prototype. If we model accurately in Revit, we can understand our designs better and foresee possible complications before they arise. Project Karma serves our teams as a tool for accountability, enabling them to keep an eye on critical project requirements. Power BI dashboards (Fig. 6) show various statistics monitored by the teams and allow global account leaders to more easily track adherence to firm and client standards.

Figure 6
Part of the role of the IA Design Intelligence group is to continually identify and develop toolsets like these, and we feel strongly that the data integration of our strategy, design, construction, and facilities processes is essential to the current and future requirements of workplace design. With the innovation of shareable dashboards, we can expand internal and client-centered communication about projects at a level and scope never before achieved.


